Why XRebel Sets the Standard for Java Performance Analysis
XRebel does things traditional profiling tools can’t. It allows developers to trace the impact of their code from beginning to end -- even in distributed applications.
Unlike traditional profilers, XRebel takes a request-based approach to performance – making performance issues clearer and more actionable.
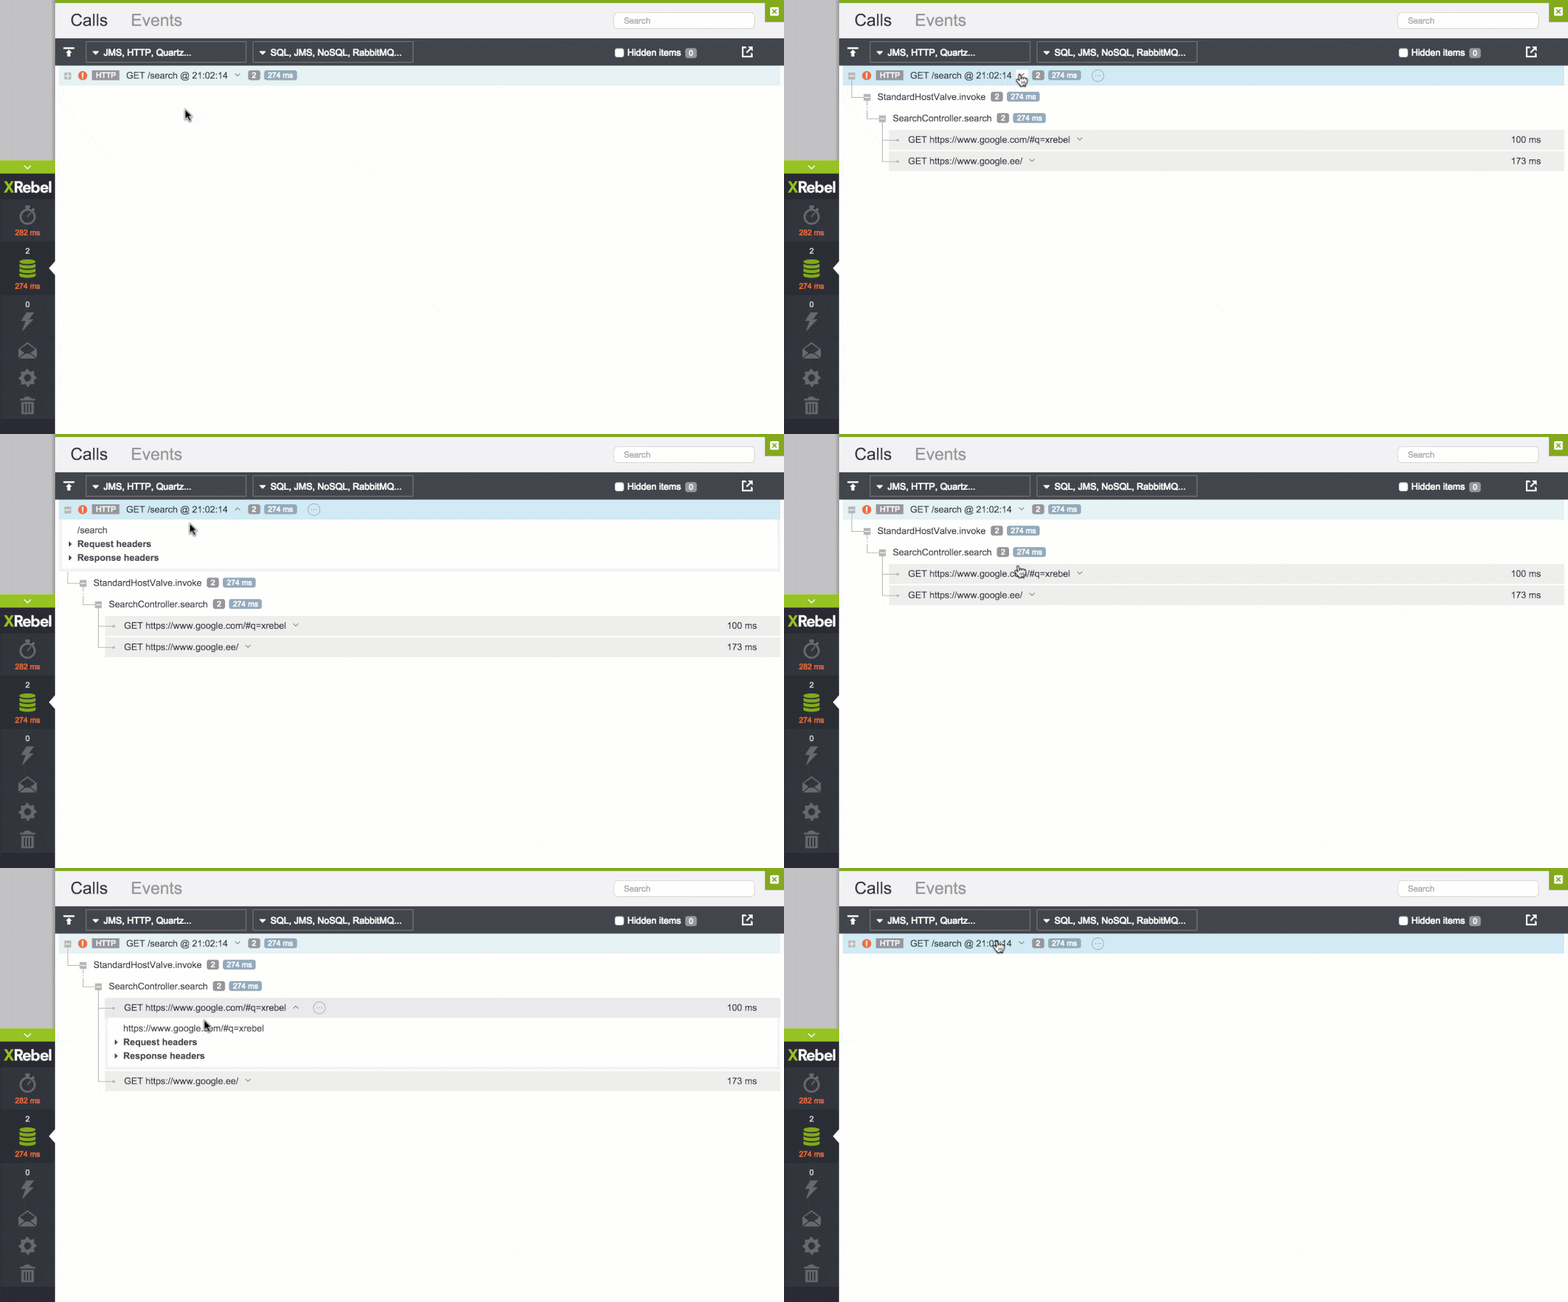
Follow your request across all XRebel-enabled services, seeing performance data for each. XRebel reveals the most time-consuming methods in your request, hiding the rest until you really need them.
With XRebel, developers can easily assess application structure and the layers involved in executing their code.
For databases, developers can quickly trace database interactions back to the application code. For distributed applications, developers see how code interacts across microservices – even if the code is merely a client for the rest of the system.
Excessive database queries can bog down application performance. By increasing visibility into how JPA and Hibernate queries relate to JDBC invocations, XRebel makes suboptimal database issues easier to diagnose and fix.
Working with MongoDB, Cassandra, HBase or Neo4j? XRebel displays each query in easy-to-parse formatting, shows which component or service executed it, and displays how long it took to complete.
XRebel brings distributed tracing into the development environment. Follow your request end-to-end in a distributed application, capturing method-level performance data and IO events.
The hierarchical overview of microservice calls helps developers understand how each service affects performance of the whole system. This helps developers to identify performance bottlenecks before they become an issue in production.

If distributed tracing, IO and performance metrics are not enough for your debugging needs, XRebel shows logs and exceptions effortlessly in the UI.
The Exceptions view reverses your stacktraces to show buried exceptions. The Logs view captures logs from loggers and standard out, showing them in UI and displaying arrays and maps as an easy-to-read tree.
From installation to troubleshooting, we provide legendary support and documentation to make sure you’re getting all XRebel has to offer.

XRebel Customer Case Studies
XRebel is the Java code analysis tool of choice for companies including ICON, Amway, Antea, and more.
Compatibility Across Java Frameworks and Technologies
See AllTry XRebel Free for 14 Days
See how XRebel can streamline your development process with a free 14-day trial.