VS Code, or Microsoft Visual Studio Code, has been gaining popularity in the Java community — and for good reason. It's a versatile, multi-language IDE (or integrated development environment). Best of all, it’s free. That makes VSCode a popular choice for students and new developers, but the IDE is also gaining traction in enterprise Java development environments.
But more than that, Java developers turn to VS Code for its debugging capabilities. Learn more about why Java developers turn to VS Code and how to leverage its debugging capabilities in this blog post.
Back to top
What is VS Code?
VS Code, or Visual Studio Code, is a development IDE from Microsoft. It combines the simplicity of a source code editor with powerful debugging tools for modern web and cloud applications.
VS Code is a newer addition of the Java IDE ecosystem. Released in 2015 by Microsoft, it was designed to provide a seamless IDE experience across a multitude of programming languages, including Java, Javascript, Rust, and PHP.
⚙️ Looking for more ways to increase efficiency in VSCode? Check out this VSCode keyboard shortcut cheat sheet.
Back to topWhy are Java Developers Using VS Code?
Simply put, Java developers use VSCode even though it’s not solely a Java IDE. VS Code doesn’t have built-in support for Java, which means you must install the Coding Pack for Java in order to write Java code in the IDE. Conveniently, this is automatically prompted by VS Code if it detects Java in your application.
According to the 2024 Java Developer Productivity Report, 19% of responding Java developers use Microsoft Visual Studio Code, or VS Code, as an IDE in their Java development practices—a number that has steadily been on the rise over the past four years. What's more, 84% of respondents using IntelliJ IDEA said they use more than one IDE in their Java development practice, with VS Code being the most popular secondary IDE.
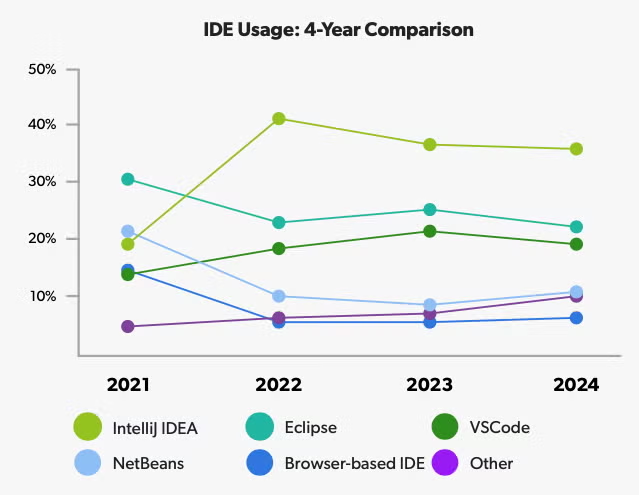
Source: 2024 Java Developer Productivity Report
Back to topWant more stats like these on the trends your Java development peers are facing and the tools they're using to solve them? Download your free copy of the 2024 Java Developer Productivity Report.
What is Debugging?
Debugging is the process of identifying and fixing errors in a software application. There are several different types of errors (bugs) that can arise in software including :
- Syntax errors. These are detected by the compiler and will produce error messages, for example mismatched parentheses and brackets.
- Typos and other errors. These may not be detected by the compiler, for example a mistake in the order of precedence writing x + y * z instead of (x + y) * z
- Logic errors. This is a mistake in the software flow and causes the software to behave incorrectly. An example is an infinite loop which causes a program to run indefinitely.
- Functional errors. This is an error where the software doesn’t behave as intended. For example, the back button on a GUI application doesn’t revert to the previous screen when clicked.
Steps in the Debugging Process
The process of debugging may include several steps but should at least contain the following:
- Identify the problem.
- Locate the source of the problem.
- Analyze the problem.
- Fix the problem.
- Validate the problem has been resolved.
Challenges of Debugging Java Applications
Debugging Java applications can present a variety of challenges, including concurrency issues, memory management, complex stack traces and more. In more detail, these include:
- Concurrency issues related to multithreaded applications such as race conditions and deadlocks.
- Memory management including memory leaks where the garbage collector is unable to release objects no longer needed and can lead to out of memory errors.
- Performance issues, identifying bottlenecks, and the effect of the JIT compiler.
- Complex stack traces caused by Java’s extensive use of exceptions can make tracking down issues challenging.
- Environment and configuration issues, such as classpath problems and environment differences.
- Third party libraries, which may contain software bugs, and can have versioning issues.
- Security restrictions, particularly in web applications, can restrict certain operations.
- Distributed systems, which have their own challenges requiring remote debugging and may make use of microservices.
- Dynamic behavior, reflection and proxies can obscure the flow of the program and make static analysis tools less effective.
- CI/CD pipelines, managing pipelines from build tools such as Maven and Gradle can introduce their own complexities.
📺 Watch this video course on installing JRebel in VS Code.
Back to topTips for Debugging in VS Code
Looking to get started using the VS Code debugger for your Java application? Follow these simple steps:
- Start debugging the current file by pressing F5 or selecting Run and Debug on the Debug start view.
- For most scenarios create a launch configuration file, which allows for editing and updating and is saved as a launch.json file in a .vscode folder.
- Set breakpoints by clicking in the editor margin or selecting F9 on the line number
- Conditional breakpoints can be set based on expressions, hit counts, or a combination of both.
- Logpoints can be used to log a message to the debug console without stopping the application. Logpoints are created by using the Add Logpoint command in the left editor gutter or by using the Debug: Add Logpoint command.
- Inspect variables in the variables section of the Run and Debug view or by hovering a mouse over the variable to see the value.
🗒️ Code faster in VS Code. Get this VS Code keyboard cheat sheet.
Debugging in Other Java IDEs
Debugging in high level languages such as Java is comparatively easier than debugging in low level languages like C or C++. That’s because Java has features built into the language such as exception handling, memory management and type checking. In programming languages such as C and C++, memory is not explicitly managed and ensuring proper memory management is the responsibility of the programmer. Memory debugging tools may be required to debug lower level languages.
Debugging in Java is similar to other languages in that you would typically use an IDE such as IntelliJ, VSCode or Eclipse to set breakpoints in the code, step through the code, and inspect the value of variables, arrays and data structures.
📚 Want to learn more about the array of Java IDEs? Check out this 101 Guide.
Back to topFinal Thoughts on Debugging in VS Code
Looking for more ways to increase productivity in VS Code? Try JRebel. The JRebel extension for VS Code integrates directly within your IDE to eliminate redeploys and save Java development time. See how much time your team could save — in any Java IDE — during your 14-day free trial.